
Why NPS is important: Practical guide to Net Promoter Score
When a friend asks for a good dentist or a reliable plumber, you probably have a name ready, and maybe a place you’d warn them about. Your customers talk about you the same way. Net Promoter Score shows how many of them would vouch for you, and that’s why NPS is important.
On its own, an NPS score won’t tell you what to fix. Use regular Net Promoter Score surveys to track results over time, find unhappy customers, collect the reasons behind their ratings, and act on them. Below, we explain how to do that.
What is NPS?
Net Promoter Score (NPS) is a customer loyalty metric built around one simple idea: loyal customers recommend you to others. A classic NPS survey asks one question:
How likely are you to recommend [company/product/service] to a friend or colleague?
People answer on a scale from 0 to 10, where 0 means “not at all likely” and 10 means “extremely likely.” Based on the answer, each respondent falls into one of three groups:
😍 Promoters (9–10): loyal customers who are happy with the experience and likely to recommend you
😐 Passives (7–8): satisfied customers who aren’t excited enough to spread the word and could switch to a competitor
😡 Detractors (0–6): unhappy customers who may leave and even discourage others from buying
Keep in mind: NPS is not an average rating. If ten customers each give you a 7, the average rating is 7, but your NPS is 0, because none of them are promoters or detractors. The score reflects the balance between your most loyal and your least satisfied customers.
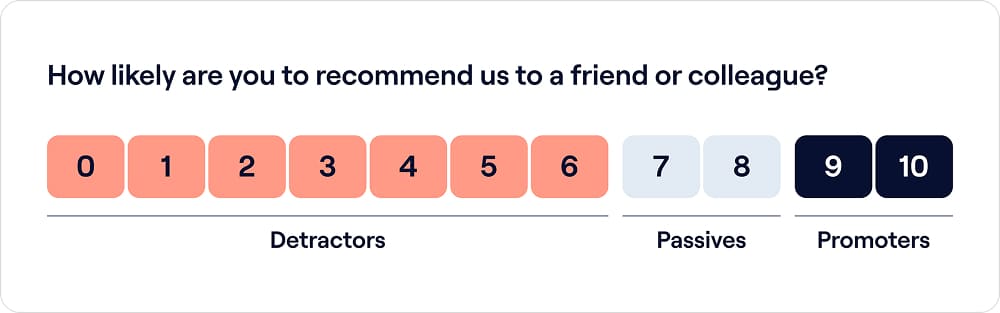
Every answer on the 0–10 scale puts a respondent into one of three groups, and NPS compares only the two at the ends
Why is NPS important?
The importance of NPS comes from what you can do with it. Here are six NPS benefits you’ll notice in practice.
1. NPS gives you a simple measure of customer loyalty
Customer loyalty is hard to discuss in a meeting. “Customers seem happier” means different things to different people, while “our NPS went from 31 to 38” is clear to everyone. One question, one scale, one formula: that’s why NPS is easy to run, easy to explain to your team, and easy to repeat the same way every quarter.
Simplicity also lowers the barrier to entry. You don’t need a data team or complex statistical models to start measuring loyalty. A short survey and a spreadsheet are enough for the first round.
2. NPS helps you track changes over time
A single NPS score is a snapshot. It tells you where you stand today, but not whether things are getting better. A series of surveys run the same way shows you the trend:
- whether your customer experience is improving or slipping
- how customer loyalty changes over months and years
- whether updates to your product, service, or communication may have affected the score
In most cases, how your own NPS changes over time says more than any single number. The trend won’t prove cause and effect on its own, but it shows you where to look.
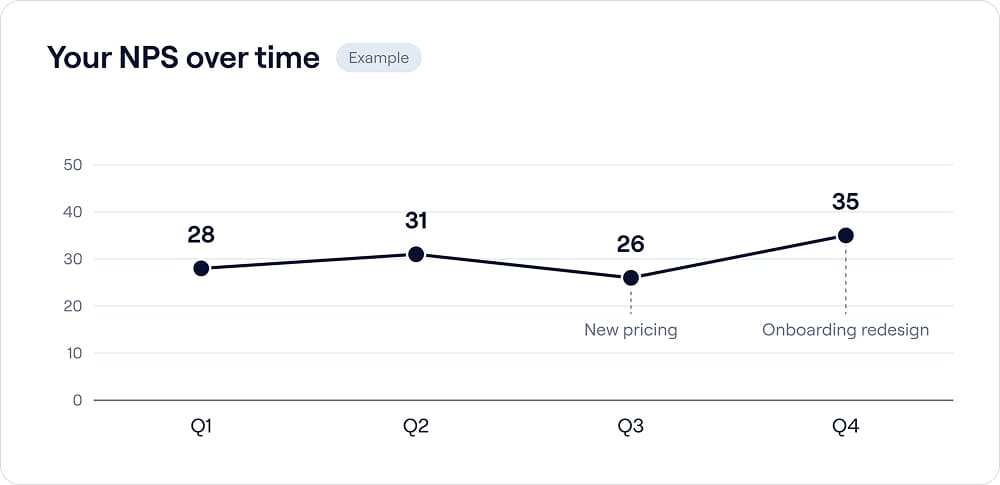
Quarterly results show the trend and help you see which changes to look into
3. NPS helps identify unhappy customers
Detractors deserve special attention. An NPS survey shows you who had a negative experience, and if you ask for contact details or link responses to your CRM, you can reach these customers directly. With detractor responses, you can:
- see which customers had a bad experience
- ask what caused the low rating
- contact them and try to fix the issue
- spot problems that keep coming up
This is the basis of service recovery: you find a problem while the customer is still with you and get a chance to make it right. A low score doesn’t automatically mean a customer will churn, though. It’s a signal to look into the problem more closely.
4. NPS helps identify promoters and potential advocates
Promoters already like what you do, and word of mouth still drives sales. According to SurveyMonkey, 54% of consumers have made a purchase based on a word-of-mouth recommendation. Promoters are the people most likely to:
- recommend you to friends and colleagues
- leave reviews
- bring referrals
- give testimonials
- share their story in a case study
NPS doesn’t decide what to do with promoters for you. It segments your audience by how people feel about your product, and then you choose the action that fits each group.

A thank-you page for respondents who scored 9 or 10 can turn a high rating into a next step, like sharing their story in a case study
5. NPS makes customer feedback easier to segment
An overall NPS score can hide important differences. When you break responses down, you see which customers are happy and which aren’t. You can segment by:
- product
- customer type
- plan
- lifecycle stage
- location
- acquisition channel
Say your overall NPS stays stable for three quarters in a row. When you split it by lifecycle stage, you notice that the score among new customers keeps dropping, while long-term customers rate you higher than before. The two trends cancel each other out in the total. Your onboarding is the first place to check.
6. NPS creates a starting point for customer experience improvements
This is the main reason why NPS is important, and also its main limit. The score shows that something is going well or badly, but it doesn’t explain what exactly to fix. To make NPS useful, add a follow-up question right after the rating, for example:
What is the main reason for your score?
Then group the answers and look for reasons that repeat. “Support takes too long to respond,” mentioned by a dozen detractors, is a clear task for your team. The score alone would only tell you that loyalty dropped.
How is the NPS score calculated?
NPS calculation takes three steps and doesn’t require any special tools. Let’s go through them with an example of 100 survey responses.
Step 1. Sort responses into groups. Split all answers into promoters, passives, and detractors:
- 60 promoters (scores 9–10)
- 25 passives (scores 7–8)
- 15 detractors (scores 0–6)
Step 2. Calculate the percentages. Divide each group by the total number of responses:
- Promoters: 60 / 100 = 60%
- Detractors: 15 / 100 = 15%
Step 3. Apply the NPS formula.
NPS = % Promoters − % Detractors
60 − 15 = 45. Your NPS is 45. It’s written as a plain number, not a percentage.
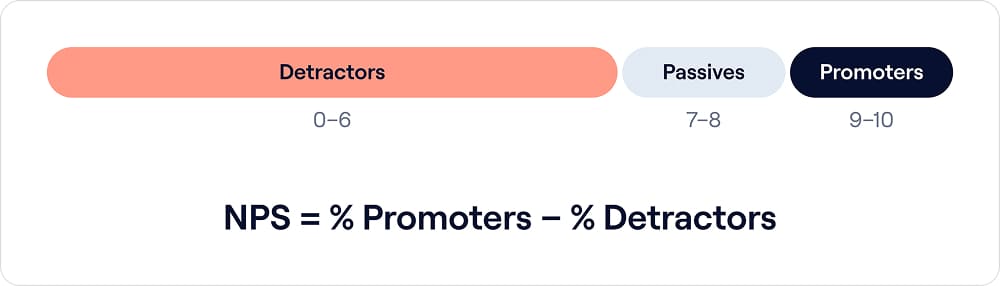
Turning one detractor into a passive raises your NPS as much as turning one passive into a promoter
A few details that often cause confusion:
👉 Passives count toward the total number of responses, but the formula doesn’t add or subtract them directly. They still affect the result through the percentages. If you had the same 60 promoters and 15 detractors but 125 passives (200 responses in total), promoters would make up 30%, detractors 7.5%, and your NPS would be 22.5.
👉 NPS ranges from −100 to +100. A score of −100 means every respondent is a detractor, and +100 means every respondent is a promoter.
👉 A score above 0 means you have more promoters than detractors.
What is a good NPS score?
There’s no universal number that makes an NPS score good. The same result can be strong in one industry and weak in another, so the honest answer to “what is a good NPS score” is: it depends on what you compare it with. Two comparisons are useful.
1. Compare your NPS with your past results
Your own history is the most reliable benchmark. You know your methodology, your audience, and what changed between surveys. Say your NPS grew from 22 to 35 while the survey method and customer base stayed comparable. That tells you more than comparing yourself to a random company with a score of 50.
2. Compare with relevant industry benchmarks
External benchmarks help as long as you compare like with like. Otherwise, you’re comparing numbers collected in different ways. Look only at:
- similar markets
- similar audiences
- a comparable way of measuring (the same question, timing, and channel)
Industry averages can be far apart. In Qualtrics XM Institute research, the grocery industry had an average NPS of 30, video streaming 29, and consumer payments −6. Location matters too: SurveyMonkey found that average scores are highest in Brazil and lowest in Japan because of differences in culture and expectations.
As a rough guide, many teams use the scoring framework from Bain & Company, cited by Qualtrics:
| NPS | What it means |
| Above 0 | Good |
| Above 20 | Favorable |
| Above 50 | Excellent |
| Above 80 | World-class |
Treat these thresholds as a starting point, not a target. Industry context counts for more than any universal number, and your own trend matters most.
How does a Net Promoter Score survey work?
A Net Promoter Score survey is short by design. In most cases, it includes:
- The core question, “How likely are you to recommend [company/product/service] to a friend or colleague?”, with a 0–10 scale.
- A follow-up question about the reason for the score.
- Optionally, a question about what you could improve and permission to contact the respondent.
You can send it by email, show it on your website or in your app, or trigger it after a specific event, such as a purchase or a closed support ticket. Many teams run it on a regular schedule, quarterly or once a year, to track overall loyalty. If you’re choosing a tool to run it, check out our overview of NPS software.
The fewer questions you ask, the more people finish the survey. You can also change the follow-up question depending on the score: ask detractors what went wrong, passives what was missing, and promoters what they liked most. In Marquiz, for example, you can build this as a quiz with branching logic, so each group sees its own follow-up question.
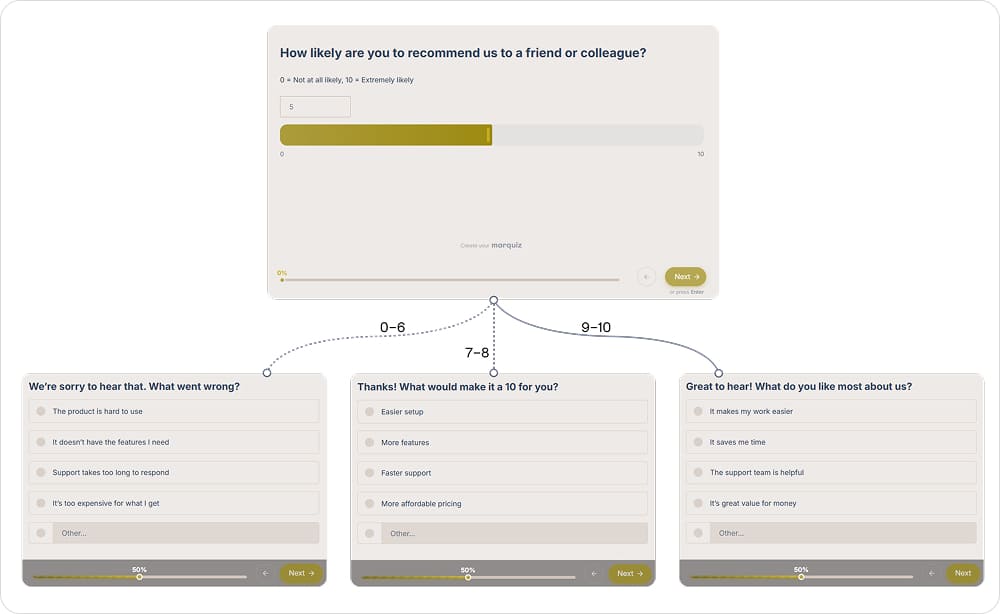
Branching keeps the survey short: each respondent sees only the follow-up question that fits their score
What to do with your NPS results
Collecting responses is the easy part. What you do after the survey closes is what moves the score. Each group of respondents needs its own next step, and the whole process should repeat.
Follow up with detractors
Start with the people who gave you 0–6, because their feedback points to the most urgent problems. Read every comment from this group and:
- find out what exactly went wrong
- group similar reasons together
- see which problems repeat across different customers
If a detractor left contact details, reach out personally. A quick reply that shows you’ve heard them can turn a frustrated customer into one who stays.
Learn from passives
Passives are easy to overlook because they don’t appear directly in the NPS formula. Yet they can easily drift away: satisfied enough to stay for now, but not attached enough to resist a better offer. Ask them one simple question: what would it take to rate us higher? Their answers often reveal small gaps, like a missing feature or slow delivery, that stand between “fine” and “great.”
Engage promoters
Promoters are already on your side, so give them an easy way to show it. Depending on your business, you can:
- invite them to leave a review
- ask for a testimonial
- offer a referral program
- invite them to take part in a case study
Keep the ask relevant. A customer who just rated your support 10 out of 10 is a great candidate for a testimonial, while a long-term client with measurable results fits a case study better. Public reviews work differently: ask all your customers for them, not only promoters. Platforms like Google don’t allow businesses to request positive reviews selectively.
Look for patterns, not individual comments only
One angry comment is a story. Twenty detractors who independently mention a complicated onboarding process are a pattern, and a much stronger signal. Tag open-ended answers by topic (pricing, support, onboarding, product quality) and count how often each topic comes up in each group. Fix the issues that repeat most among detractors and passives first.
Track whether changes affect future scores
Once you’ve made changes, measure again with the same question, a comparable audience, and similar timing. This turns NPS into a cycle:
Survey → feedback → identify the problem → make changes → survey again → compare
Genroe, a customer experience consultancy, shares two client examples of this cycle in action. AccessPay raised its NPS from 15 to 53 in two years, and Zip Water UK went from +2 to +73 in three. In both cases, the growth came from fixing specific issues customers had raised, not from chasing the score.
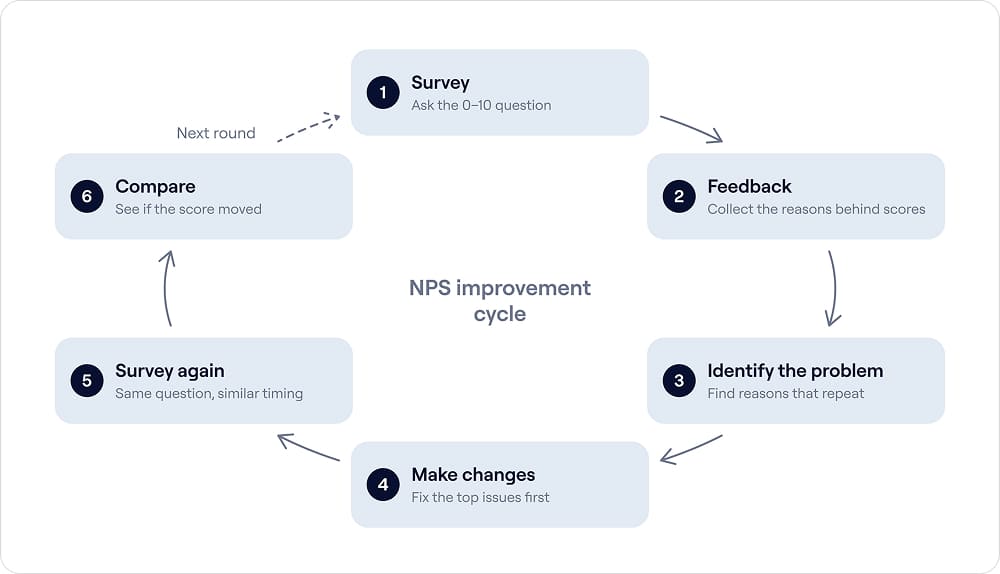
Each new survey shows whether the changes you made after the previous one actually helped
Limitations of NPS
NPS is useful, but it doesn’t give you a complete picture of customer experience. Knowing its limits helps you avoid wrong conclusions and decide what to measure alongside it.
The score does not explain why
Without follow-up feedback, NPS shows a symptom, not a cause. A drop from 40 to 30 tells you something changed, but not whether it’s pricing, product bugs, or a new support policy. That’s why the open-ended question about the reason for the score is a must.
Benchmarks vary
Industry, market, and audience all shape results. Average scores differ across industries and countries, so a score of 30 can be strong in one context and weak in another. Comparing yourself with companies that measure differently can be misleading.
Survey responses can be biased
Not every customer answers. The most engaged customers, both enthusiastic promoters and unhappy detractors, are often the most likely to respond, while quieter customers stay silent. To get a more balanced picture, keep the survey short and send it at a convenient moment.
NPS is only one customer experience metric
NPS measures the overall relationship, but it won’t tell you how a specific interaction went. Two other common metrics fill that gap, and each answers its own question:
| Metric | Typical question | What it shows |
| NPS | How likely are you to recommend us? | Overall loyalty to the company or product |
| CSAT (Customer Satisfaction Score) | How satisfied were you with [experience]? | Satisfaction with a specific product, service, or interaction |
| CES (Customer Effort Score) | How easy was it to [complete an action]? | How much effort a task took |
Use NPS to track the overall relationship, and add CSAT or CES when you need to understand specific touchpoints. For ready-made wording, see our customer satisfaction survey questions.
FAQ

Key takeaway
📌 NPS is useful because it turns customer loyalty into a metric you can track over time. But the score itself is only the starting point. Its real value comes from understanding why customers gave their rating, acting on that feedback, and measuring whether the customer experience improves.